[Blog] For labs
Turn a paper into a 30-second explainer
Give the agent the claim, one number, one figure idea and a final line. The video is drawn by code, so the numbers on screen are the ones you typed.
To turn a paper into a 30-second explainer, give the agent four things: the claim in one sentence, one number with its unit and context, one idea for a figure, and the final line. The video is drawn by code, so the numbers on screen are the ones you typed. For a research video that property matters more than polish.
Why exact numbers on screen matter
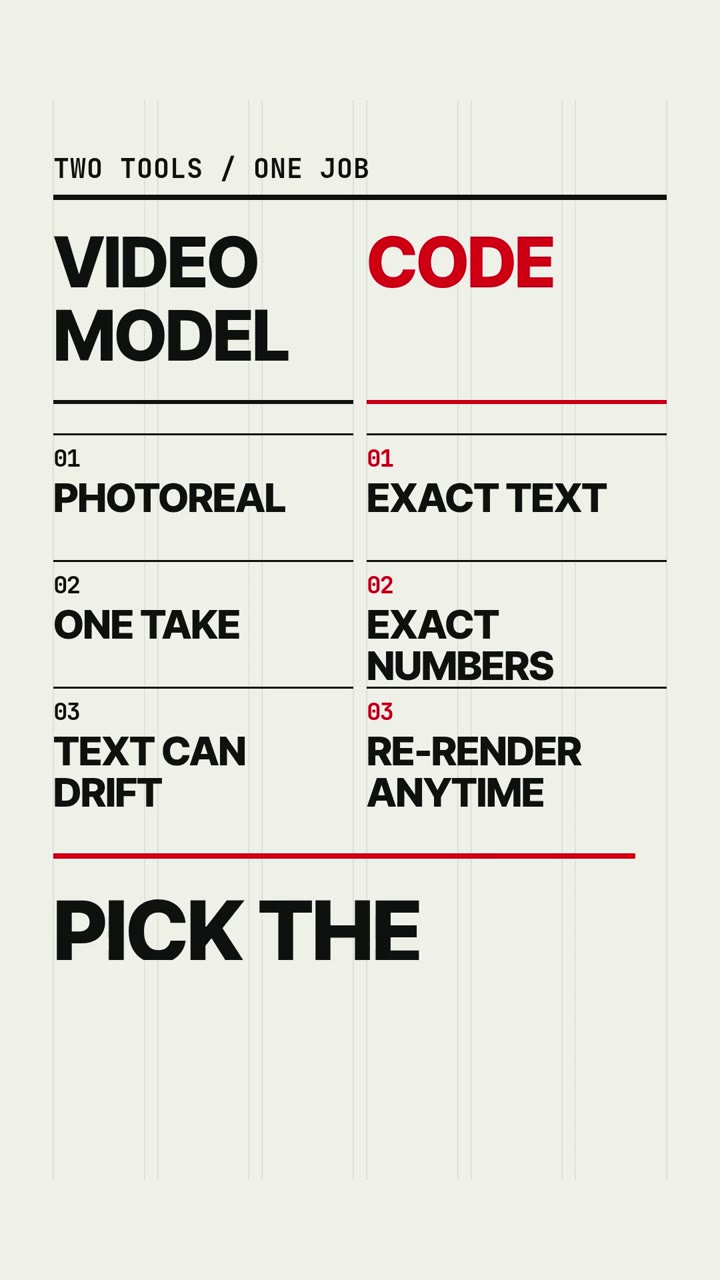
A number in a research video is a claim. If your paper says 84.6 % and the frame says 84.8 %, the clip is a wrong citation with your lab's name on it.
Here a number is a value in a program. In the Data Story style the height of each bar comes from the values in your prompt, and each label is a string. Nothing estimates what a chart like yours would probably look like.
The agent also has no internet. It cannot look up your paper, a baseline or a citation count, so it cannot quietly add a fact you did not give it. The other side of that: it only knows what the prompt says. Read the finished video against the paper before you post it, because the agent can still misread a brief.
The template
Claim:  Title "<the question the result answers>".
Figure: <one figure the style can draw, described in a sentence, with every value it needs>.
Number: Highlight <the one value that carries the claim>. Label "<what is measured, on what>". Note "<n, seeds or dataset>".
Final:  End on the words "<the claim as a short sentence>".
The four labels are for you. Leave them out of the prompt and keep the sentences.
Filled in for a 30-second Data Story video:
Title: "Does retrieval help small models?" Bars for accuracy with retrieval at three model sizes: S 70.4, M 78.9, L 82.0. A line for accuracy without retrieval: S 61.0, M 72.3, L 80.1. Label the axis "accuracy %, held-out set (illustrative)". Small note "n = 5 seeds". Highlight S and count up the gap "+9.4 points". End on the words "Smaller models gain more."
What makes it work:
- The claim is the last line. A viewer who remembers one thing remembers "Smaller models gain more."
- One number carries it. The highlight is "+9.4 points". The other six values are there to draw the figure, and all six are given.
- One figure. The Data Story style draws bars and one line, allows at most eight categories, and highlights exactly one point.
- The figure is described, never referenced. "Figure 3 from the paper" means nothing to an agent that cannot see the paper.
The video above is the short version of the same idea: one result in 15 seconds, with a meter that climbs from 71.2 % to 84.6 %.
Which style suits which paper
| Style | Use it for |
|---|---|
| Data Story | One chart with one message: bars grow, a line draws on, one point is highlighted |
| Whiteboard | A concept in three drawings, with one red arrow for the part that matters |
| Blueprint | An architecture or pipeline as labelled parts that assemble at the end |
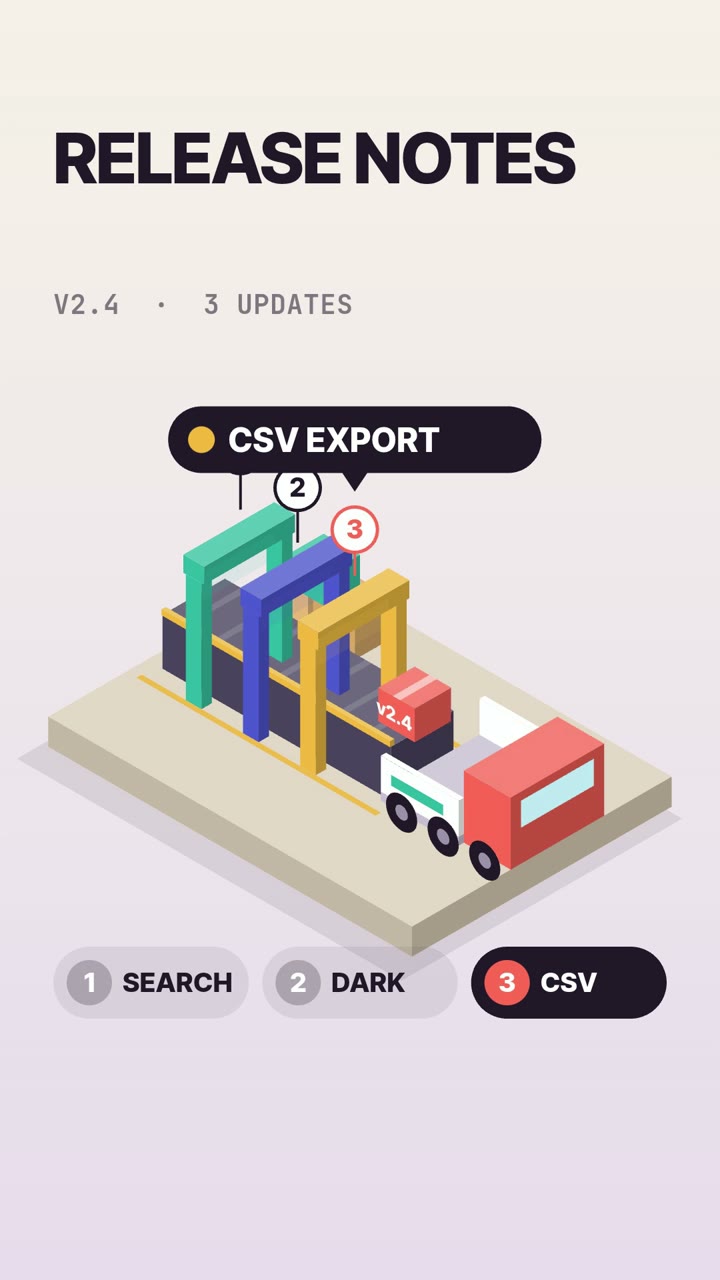
| Iso Infographic | A process with stations, such as collect, train, evaluate, in numbered steps |
| Hologram HUD | A single result or a dataset release, as readouts around a wireframe object |
A method paper usually wants Whiteboard or Blueprint. A results paper wants Data Story. More example briefs are on the page for labs.
The "(illustrative)" label discipline
Any number in the video that is not a measured result from the paper gets the word "illustrative" on screen. That covers made-up examples, schematic curves and rounded placeholders.
The hero video does this. Its 71.2 % and 84.6 % come from no paper, so the label in the prompt reads "accuracy, held-out set (illustrative)". The filled template above does the same, because we invented those six values for this post.
Two of our styles enforce a version of this themselves. Data Story and Swiss Motion instruct the agent to label invented numbers ILLUSTRATIVE. That is a safety net. The working rule is simpler: never leave a number for the agent to fill in.
For real results, do the opposite and make the number checkable. Say in the prompt that the values are measured, put the source in the label ("Table 2"), and put n, the seeds or the dataset in a small note. Then check the labels on the finished video: Data Story's rules are cautious about statistics, and a measured result must not go out marked as illustrative.
Cost and plan
A video of 21 to 30 seconds costs 700 credits on Standard and 2,100 on Pro. The Starter plan stops at 20 seconds, so a 30-second explainer needs Creator ($49 a month, 6,000 credits) or Studio. Creator's credits cover eight 30-second Standard videos a month.
A 15-second single-result clip like the one above is 500 credits, and that one took 4 min 16 s to make. We have not timed a 30-second job since our last rendering change. Expect minutes, with a cut-off at 40 minutes on Standard.
Where this does not fit
- Your actual figures. There is no image upload. The agent redraws a figure from your description, in the style's manner.
- Equations. The bundled typefaces cover Latin and Latin Extended only. Write "alpha" in words and leave the formula in the paper.
- Dense tables. About seven words are on screen at once. One chart, one message.
- Photos of people, labs or equipment. Everything is drawn by code.
- A talk. The cap is 40 seconds.
- Peer review. The video shows what you typed, including your typos.
Questions
Can the agent read my paper or PDF?
No. A job takes a text prompt of up to 2,000 characters, and the sandbox has no internet. Put the claim, the numbers and the labels in the prompt.
Will the numbers on screen be exactly the ones I wrote?
They are drawn from the values and quoted strings in your prompt, with no diffusion model painting digits. The agent can still misread a brief, so compare the video with the paper before publishing.
How long can a research explainer be?
5 to 40 seconds. Videos over 20 seconds need the Creator or Studio plan.
Which style is best for a results chart?
Data Story. It draws one chart with up to two series, grows the bars in order and highlights a single point with a number that counts up.